
Differential Rate Allocation Under Non Linear Expenditure Slopes
Dynamic rate allocation adjusts capital disbursement velocity using the derivative of the expenditure slope to prevent acceleration-driven liquidity drag.
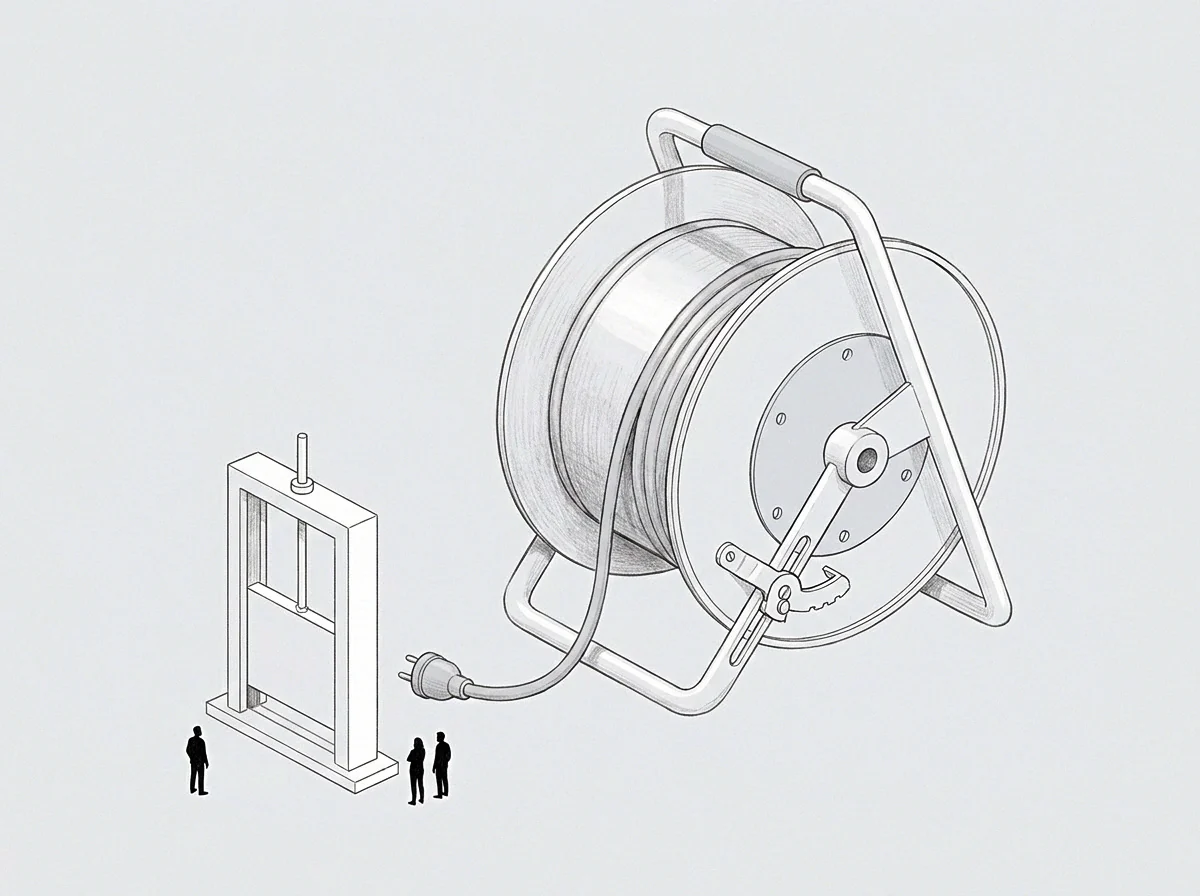
Gradient
Deploying capital on fixed monthly disbursements causes structural drift whenever operational spending accelerates. Outflows remain flat while compute, customer acquisition, or infrastructure costs climb along a convex curve, quietly draining reserve capacity. Standard planning assumes costs rise predictably alongside operational scale, but actual expenditure often steepens so that each additional increment costs substantially more than the last.
Distributing capital at a uniform rate across non-linear cost curves burns reserves fastest right where marginal returns drop off. Preventing this requires sizing allocations to the local derivative of the cost curve itself. Measuring that rate differential against delivered value provides a concrete check on capital efficiency, whereas flat distribution treats every dollar spent as equivalent.
In non-linear environments, that assumption fails, funneling money into low-return sinks while starving higher-yield work.
Differential rate scaling tied directly to the spending gradient stabilizes total system liquidity before cost acceleration reaches critical velocity.
Rate adjustments work as a derived metric. Value serves as the reference axis, allowing the allocation gradient to reflect spending velocity directly without arbitrary targets. Operating without this calculation leaves teams reacting only after budgets blow out, and that lag between cost acceleration and capital re-allocation compounds the financial loss.
Fixed distributions across steepening cost curves routinely underfund efficient growth channels while pouring cash into accelerating burn sinks.
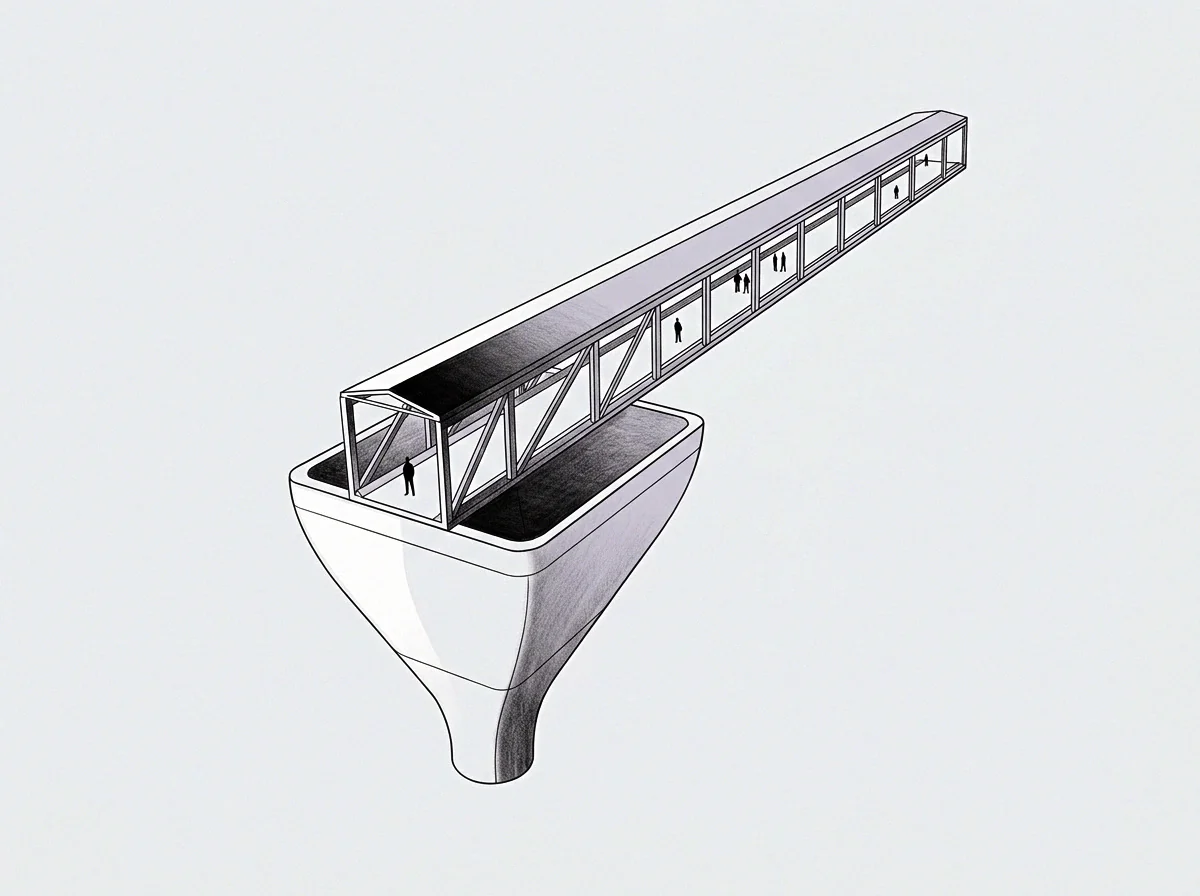
Gate
Control systems manage steepening spending curves through threshold boundaries. The primary switch acts as an evaluation gate, throttling capital flow the moment spending acceleration passes a set threshold ratio.

Threshold Dynamics in Accelerating Spending Environments
A static gate releases capital at a constant rate regardless of downstream friction. As non-linear costs kick in, that rigidity destabilizes operations: teams exhaust funds before the next cycle opens, bringing work to a halt. An adaptive gate adjusts release speeds to match the measured slope of consumption instead.
The gating logic monitors two inputs simultaneously: the current burn rate and the second derivative of the spending curve. So long as acceleration remains flat, the gate stays wide open. When acceleration turns positive, it constricts flow to dampen non-linear runaway and keep the balance sheet away from severe drawdowns.

Why Does Uniform Gating Accelerate Capital Drag?
Uniform gating forces every business unit onto the same funding schedule regardless of how its expenses behave. A team paying predictable, linear software licenses gets capital on the exact same schedule as a machine-learning group dealing with quadratic compute bills. The compute group runs through its allocation long before the first team taps its reserves, leaving capital trapped in quiet accounts while the high-burn project stalls.
A gating threshold pegged to linear averages starves compounding operations while tying up unused cash in static budgets.
Properly built gating mechanisms act as shock absorbers, turning exponential spending spikes into manageable linear trajectories. The operator defines a target threshold from the maximum acceptable drawdown rate. The system then tracks spending deviations against that target, recalibrating flow resistance at set review intervals.
Maintaining operational momentum becomes difficult once spending spikes force protective gates to clamp down on core growth initiatives.

Convexity
Accelerating costs require explicit mathematical models that align capital allocation with actual spending patterns. Convexity reflects how fast spending steepens as operational output grows. In linear setups, doubling volume doubles the bill; in convex ones, doubling volume can quadruple costs or worse.
Handling that reality requires evaluating each funding model against how it breaks.
| Allocation Mechanism | Rate Differential Derivative | Capital Efficiency at Scale | Systemic Failure Mode |
|---|---|---|---|
| Flat Rate Distribution | Zero derivative (Static flow) | Severe degradation above scale baseline | Sudden liquidity exhaustion |
| Proportional Scale Allocation | Constant linear derivative | Moderate loss on steepening curves | Persistent budget variance debt |
| Gradient Differential Allocation | Dynamic second-order derivative | Optimal value axis alignment | Local minimum stagnation |
Tracking the second derivative of the spending curve provides the baseline metric for differential allocation. A positive value marks convex acceleration, while a negative value points to concave stabilization. An effective distribution strategy throttles funding speed whenever that second derivative climbs, requiring teams to refine operational efficiency before drawing down further capital.
When cost curves steepen, traditional financial planning usually resorts to arbitrary budget caps. Those limits address the symptom instead of the underlying cause, halting progress outright instead of shifting funds toward higher marginal returns. By contrast, a gradient framework throttles allocations gradually, avoiding disruptive work stops while keeping spending in check.
Taking the path of least resistance almost always leads to convex cost blowouts. Organizations drift into exponential spending because moving large sums quickly creates an illusion of momentum. Enforcing tighter spending constraints exposes hidden inefficiencies, pushing engineering and operations to build leaner systems rather than paying their way out of architectural bottlenecks.
Throttling capital allocations during sharp cost acceleration turns operational bloat into practical engineering discipline.
When cost curves steepen past baseline projections, an automated system throttles disbursements before quarterly budget limits absorb the damage.

Routing
Dynamic distribution requires an explicit routing system to shift liquidity between competing initiatives. A concrete example illustrates how these adjustments function in practice: an enterprise software company deploys capital across three distinct product channels over a twelve-month observation window. Channel A maintains a linear spending rate, Channel B follows a parabolic curve driven by infrastructure demand, and Channel C incurs step-function cost jumps tied to regulatory compliance hurdles.
Under a conventional plan, each channel receives twenty-five percent of total capital at the start of each quarter. By month five, Channel B burns through its funding because of compounding compute demands. Channel A still holds unspent cash, while Channel C sits on idle reserves waiting for its next compliance milestone.
Overall output stalls even though the company still holds ample cash in reserve.
Deploying a differential allocation router prevents this imbalance. The mechanism checks spending velocity every seven days, redistributing capital according to four operational variables:
- Consumption Acceleration Index measures the weekly shift in spending slope across all active operational channels.
- Marginal Yield Gradient calculates the exact dollar value returned per incremental unit of capital deployed on specific axes.
- Threshold Proximity Ratio determines the distance between current expenditure accumulation and total channel reserve limits.
- Reallocation Latency Period establishes the minimum time delay required between rate changes to avoid operational oscillation.
The router pulls idle funds from Channel A and Channel C and routes them to Channel B as long as Channel B’s marginal return stays positive. The instant its cost slope climbs faster than its returns, the router trims Channel B’s disbursement rate and sweeps the difference into a central reserve. This ongoing rebalancing keeps the system stable without expanding overall budgets.
Teams routinely pad spending estimates with artificial buffers. These safety margins mask true cost slopes and present a deceptively flat burn rate to treasury teams. Differential allocation exposes that padding by tying disbursement speed to real-time consumption rather than static quarterly requests.
Where teams resist that transparency, structural inefficiencies usually sit unaddressed.
Establishing an explicit operating rule for derivative rate scaling turns rigid annual budgets into an adaptive liquidity control loop.

Yield
Differential rate allocation under non-linear cost curves aims to maximize terminal yield. Because value exists independently of short-term cost spikes, linking capital distribution to spending slopes helps the organization find a balanced operating tempo. Funds move unobstructed into high-margin channels, while steepening cost sinks trigger immediate throttling.
Every operating model eventually hits structural limits. Pushing beyond them without revising allocation mechanics triggers sharp cost increases for diminishing returns. Hitting these operational ceilings signals that workflows require fundamental redesign rather than simple cash infusions.
Tracing those pressure points reveals exactly where the current architecture buckles under non-linear demand.
Restricting capital velocity along steep cost curves compels teams to resolve technical and operational debt rather than papering over bottlenecks with extra capital. The resulting discipline allows the organization to scale reliably without exposing reserves to unchecked cost acceleration.